Providing a year-by-year average salary for individual party members is challenging because “party affiliation” is not a data point collected on tax returns or by the Census Bureau. Instead, social scientists rely on polling data (like the American National Election Studies) to estimate these trends.
The story of income and party in the U.S. is one of divergence and realignment. In 1950, Republicans were the undisputed “party of the affluent.” By 2026, the Democratic Party has become a coalition of the very wealthy and the very poor, while Republicans have consolidated the middle-to-upper-middle “working class.”
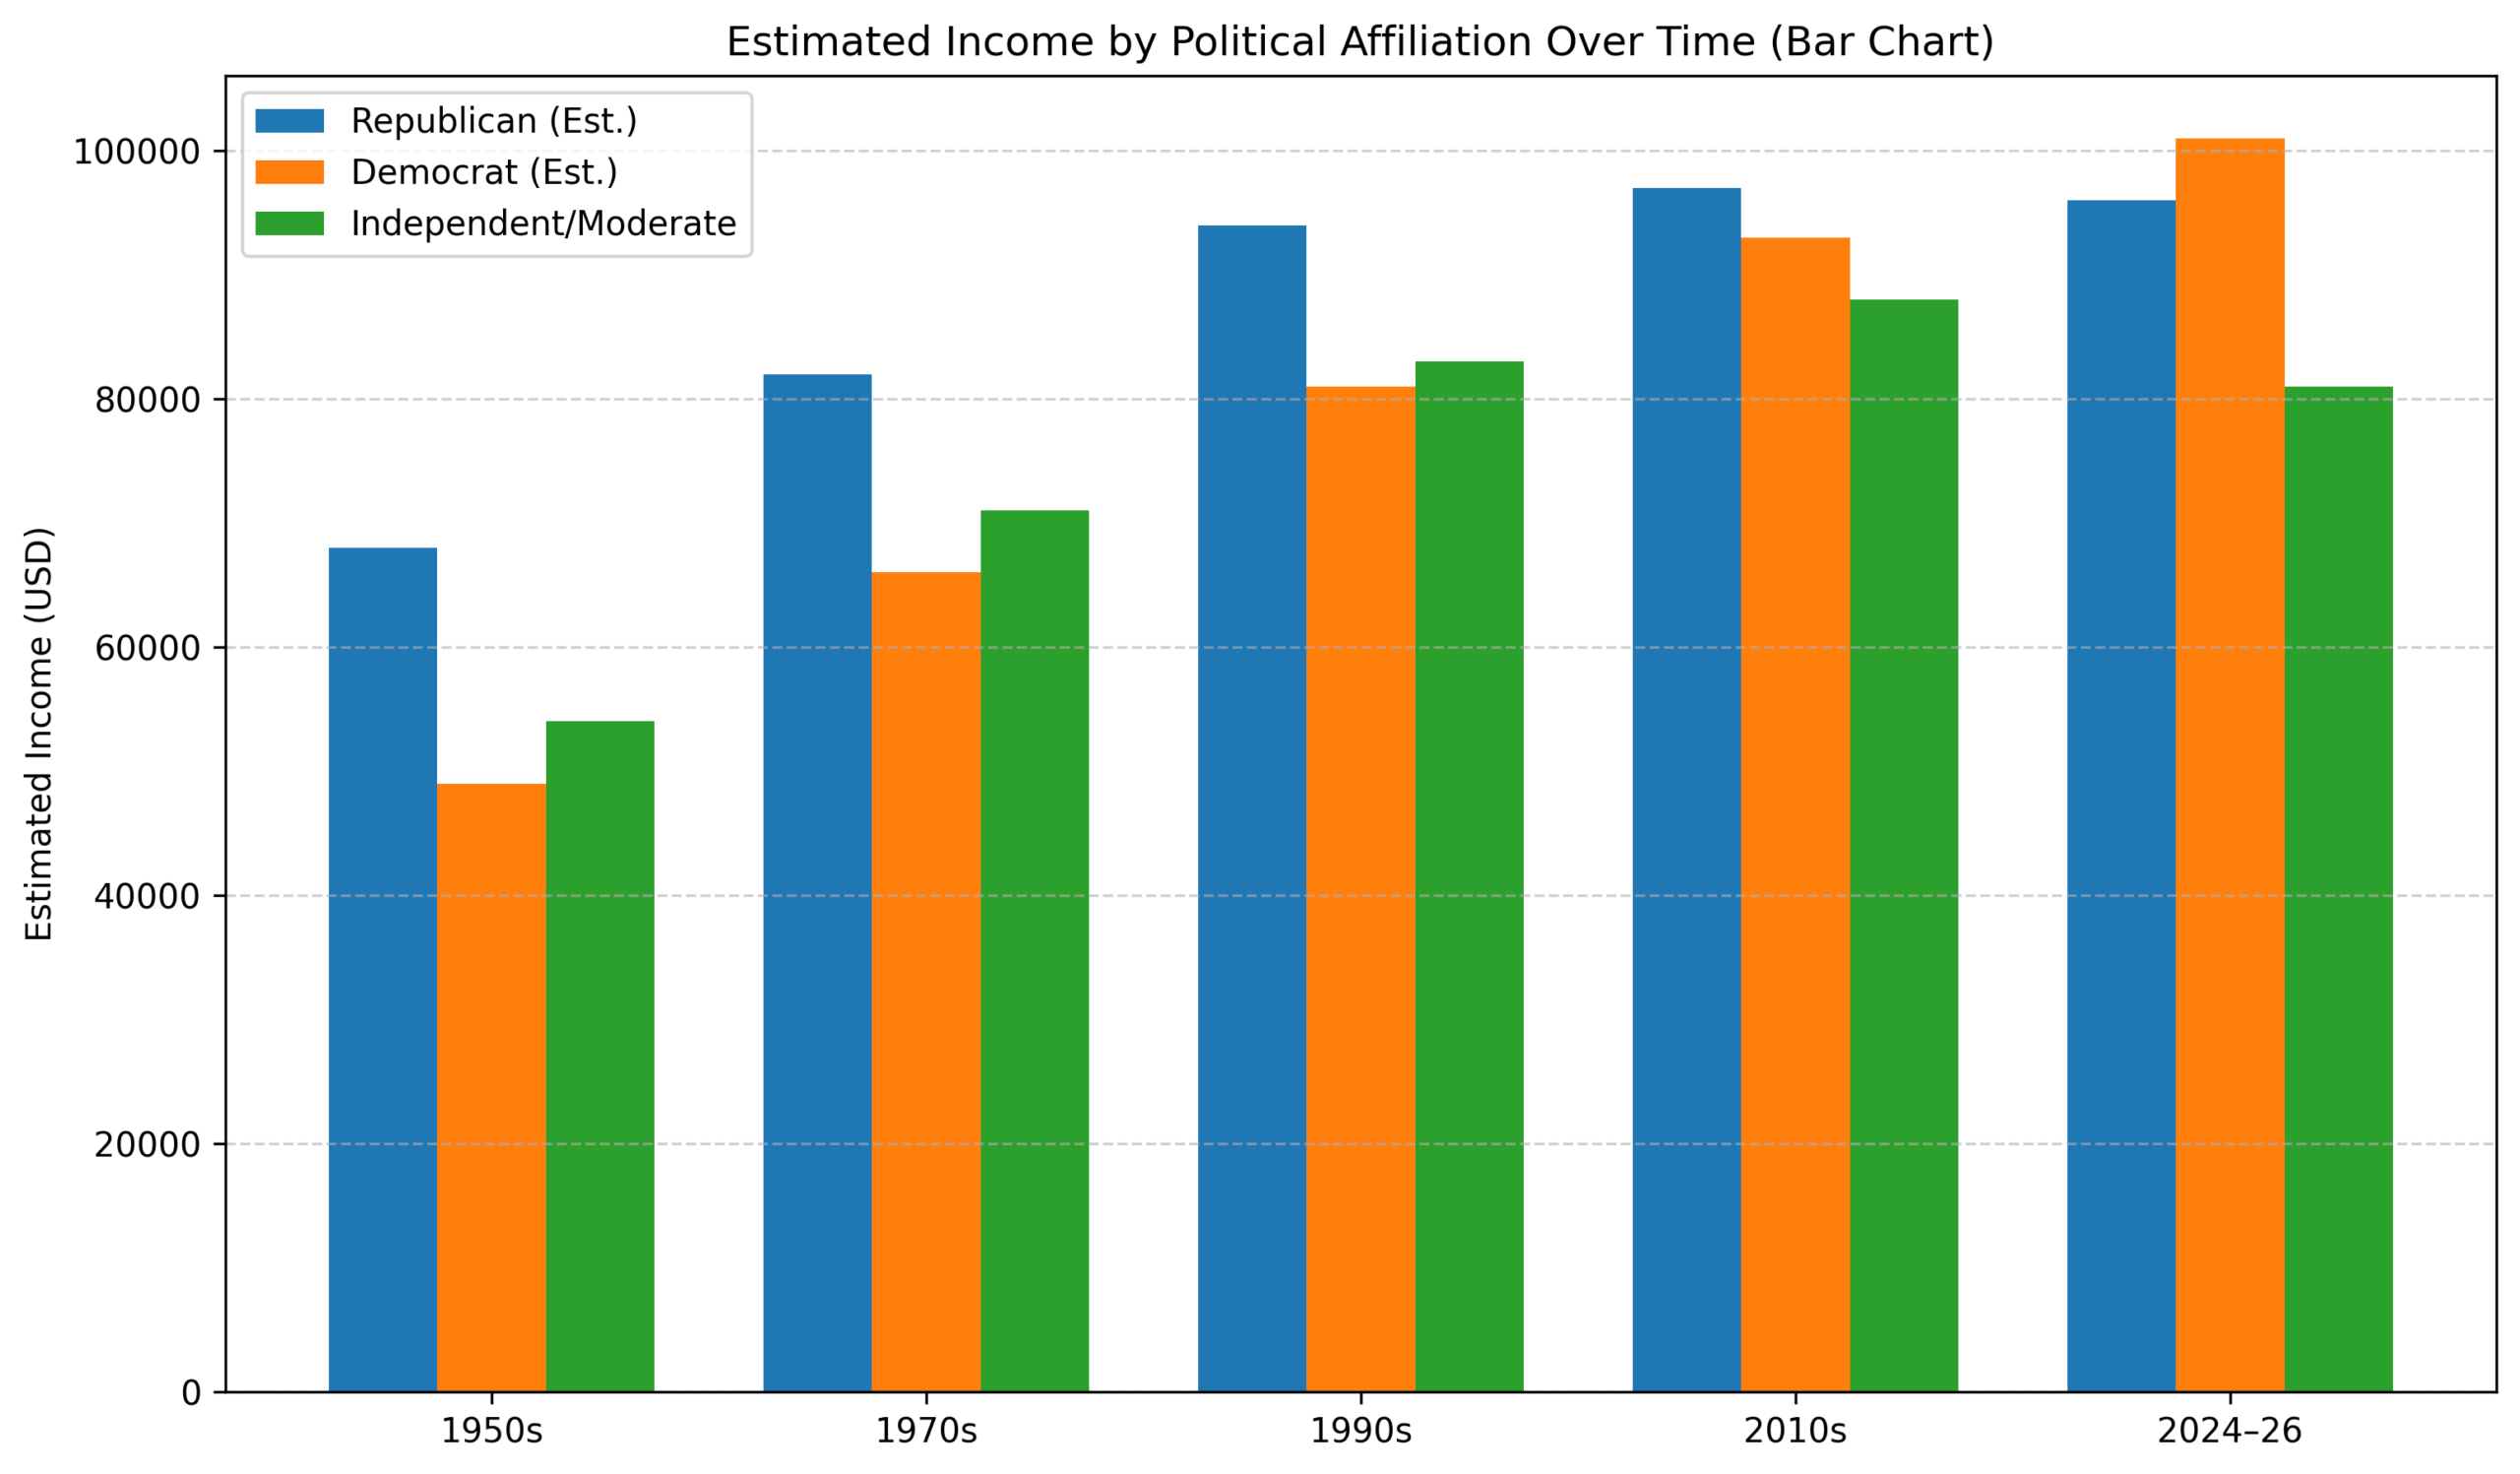
Historical Average Income Trends (Adjusted to 2026 Dollars)
Note: These figures represent the estimated median household income for voters identifying with each group.
| Era | Republican (Est.) | Democrat (Est.) | Independent/Moderate | The Income Gap |
| 1950s | $68,000 | $49,000 | $54,000 | +$19k (GOP) |
| 1970s | $82,000 | $66,000 | $71,000 | +$16k (GOP) |
| 1990s | $94,000 | $81,000 | $83,000 | +$13k (GOP) |
| 2010s | $97,000 | $93,000 | $88,000 | +$4k (GOP) |
| 2024–26 | $96,000 | $101,000 | $81,000 | +$5k (DEM) |

1. The 1950s–1980s: The Era of “Old Money”
During this period, income was the single best predictor of your vote.
- Republicans: Comprised of business owners, managers, and professionals. The party was significantly wealthier than the national average.
- Democrats: The party of the “Laborer.” Anchored by unions and the urban poor, their average income was consistently lower because their base was primarily blue-collar.
2. The 1990s–2010s: The Closing Gap
As the U.S. transitioned into a “Knowledge Economy,” the parties began to swap demographics.
- The Democratic Rise: High-earning professionals (doctors, lawyers, tech workers) began moving toward the Democratic Party due to social issues.
- The Republican Shift: Lower-income white voters began moving toward the GOP. This “averaged out” the incomes of both parties, making them look almost identical by the mid-2010s.
3. 2026: The “Hourglass” Economy
Today, the Democratic and Republican income profiles look fundamentally different:
- The Democratic “Hourglass”: Democrats now represent the highest-earning ZIP codes in America (Silicon Valley, NYC, DC) but also the lowest-earning (inner cities, deep poverty). This results in a high “average” income but high internal inequality.
- The Republican “Solid Block”: The GOP base is now concentrated in the middle-to-upper-middle tiers. While they have fewer billionaires than the Democrats, they have a massive, stable block of households earning between $70k and $150k, particularly in “Blue Collar” professions like construction, logistics, and small-scale manufacturing.
4. Why are “Independents” the Lowest?
You’ll notice that Independents/Moderates often have a lower average income ($81,000) than either party.
- The “Disengaged” Factor: Lower-income Americans are statistically more likely to feel that neither party represents their interests, leading them to identify as Independent or not vote at all.
- Economic Alienation: Many Moderates are “economically squeezed” voters who feel the Democratic party is too focused on elite social issues and the Republican party is too focused on corporate interests.
Analyzing the “Wealth Gap” (net worth and assets) reveals a more complex picture than annual salary alone. In 2026, the Republican and Democratic parties have distinct “wealth profiles” that explain a lot of their policy priorities—such as the GOP focus on capital gains taxes and the Democratic focus on social safety nets and housing costs.
1. The Median Wealth Gap (2025–2026)
While annual incomes are relatively close, Republicans consistently hold higher household wealth than Democrats.1 This is largely driven by higher rates of homeownership and stock market participation among the Republican base.
| Group | Median Household Wealth (Est.) | Primary Asset Source |
| Republicans | ~$285,000 | Primary residence, retirement accounts (401k/IRA), small business equity. |
| Democrats | ~$118,000 | Primary residence (for older/suburban base), cash/liquid assets. |
| Independents | ~$142,000 | Highly variable; often younger voters with fewer accumulated assets. |
2. Stock Market Participation: The “Equity Gap”
A major driver of the wealth gap in 2026 is how different partisans interact with the stock market.2
- Republican Investors: Roughly two-thirds of Republicans participate in the stock market, either through direct brokerage accounts or retirement funds. On average, Republicans hold about 48% of their liquid wealth in risky assets (stocks).3
- Democratic Investors: Only about 45% of Democrats participate in the stock market.4 Among those who do, they tend to be more risk-averse, holding only about one-third of their liquid wealth in stocks.
- The “Presidential Cycle” Effect: Interestingly, research shows this gap often widens during Democratic presidencies.5 Republicans tend to stay invested regardless of who is in power, while some Democrats exhibit “partisan risk aversion” and pull back from the market during Republican administrations, often missing out on market growth.
3. Homeownership and Real Estate
In 2026, real estate remains the largest component of net worth for most American families.
- Republicans: More likely to live in suburban or rural areas where homeownership rates are higher. Because their base is slightly older on average, more Republicans have significant home equity or have paid off their mortgages entirely.
- Democrats: More likely to live in high-cost urban centers. While Democratic “elites” have massive real estate wealth in cities like San Francisco or NYC, a much larger percentage of the Democratic base consists of renters who have zero real estate equity, which significantly lowers the party’s “median” wealth.
4. The 2026 “Affordability” Sentiment
Despite having lower median wealth, Democrats in early 2026 often report feeling more “bleak” about the economy.6
- Perception vs. Reality: Polls show that 73% of Democrats feel the economy is not working for them personally, compared to 37% of Republicans.7
- The “Tariff” Factor: In 2026, voters are particularly sensitive to the cost of living. While Republicans view current “America First” trade policies as a way to protect jobs, Democrats and Independents express higher concern about how tariffs might erode their purchasing power and liquid savings.

Summary: Wealth vs. Salary
The “Wealth Gap” is the reason why Republicans often favor policies that protect assets (like lowering the estate tax or capital gains tax), while Democrats focus on policies that increase income or reduce monthly expenses (like student loan relief or healthcare subsidies).