Comparing the college education statistics of 1960 to 2026 reveals a complete inversion of the American political landscape. In the mid-20th century, the relationship between education and voting was almost the exact opposite of what it is today.
1. The Great Inversion
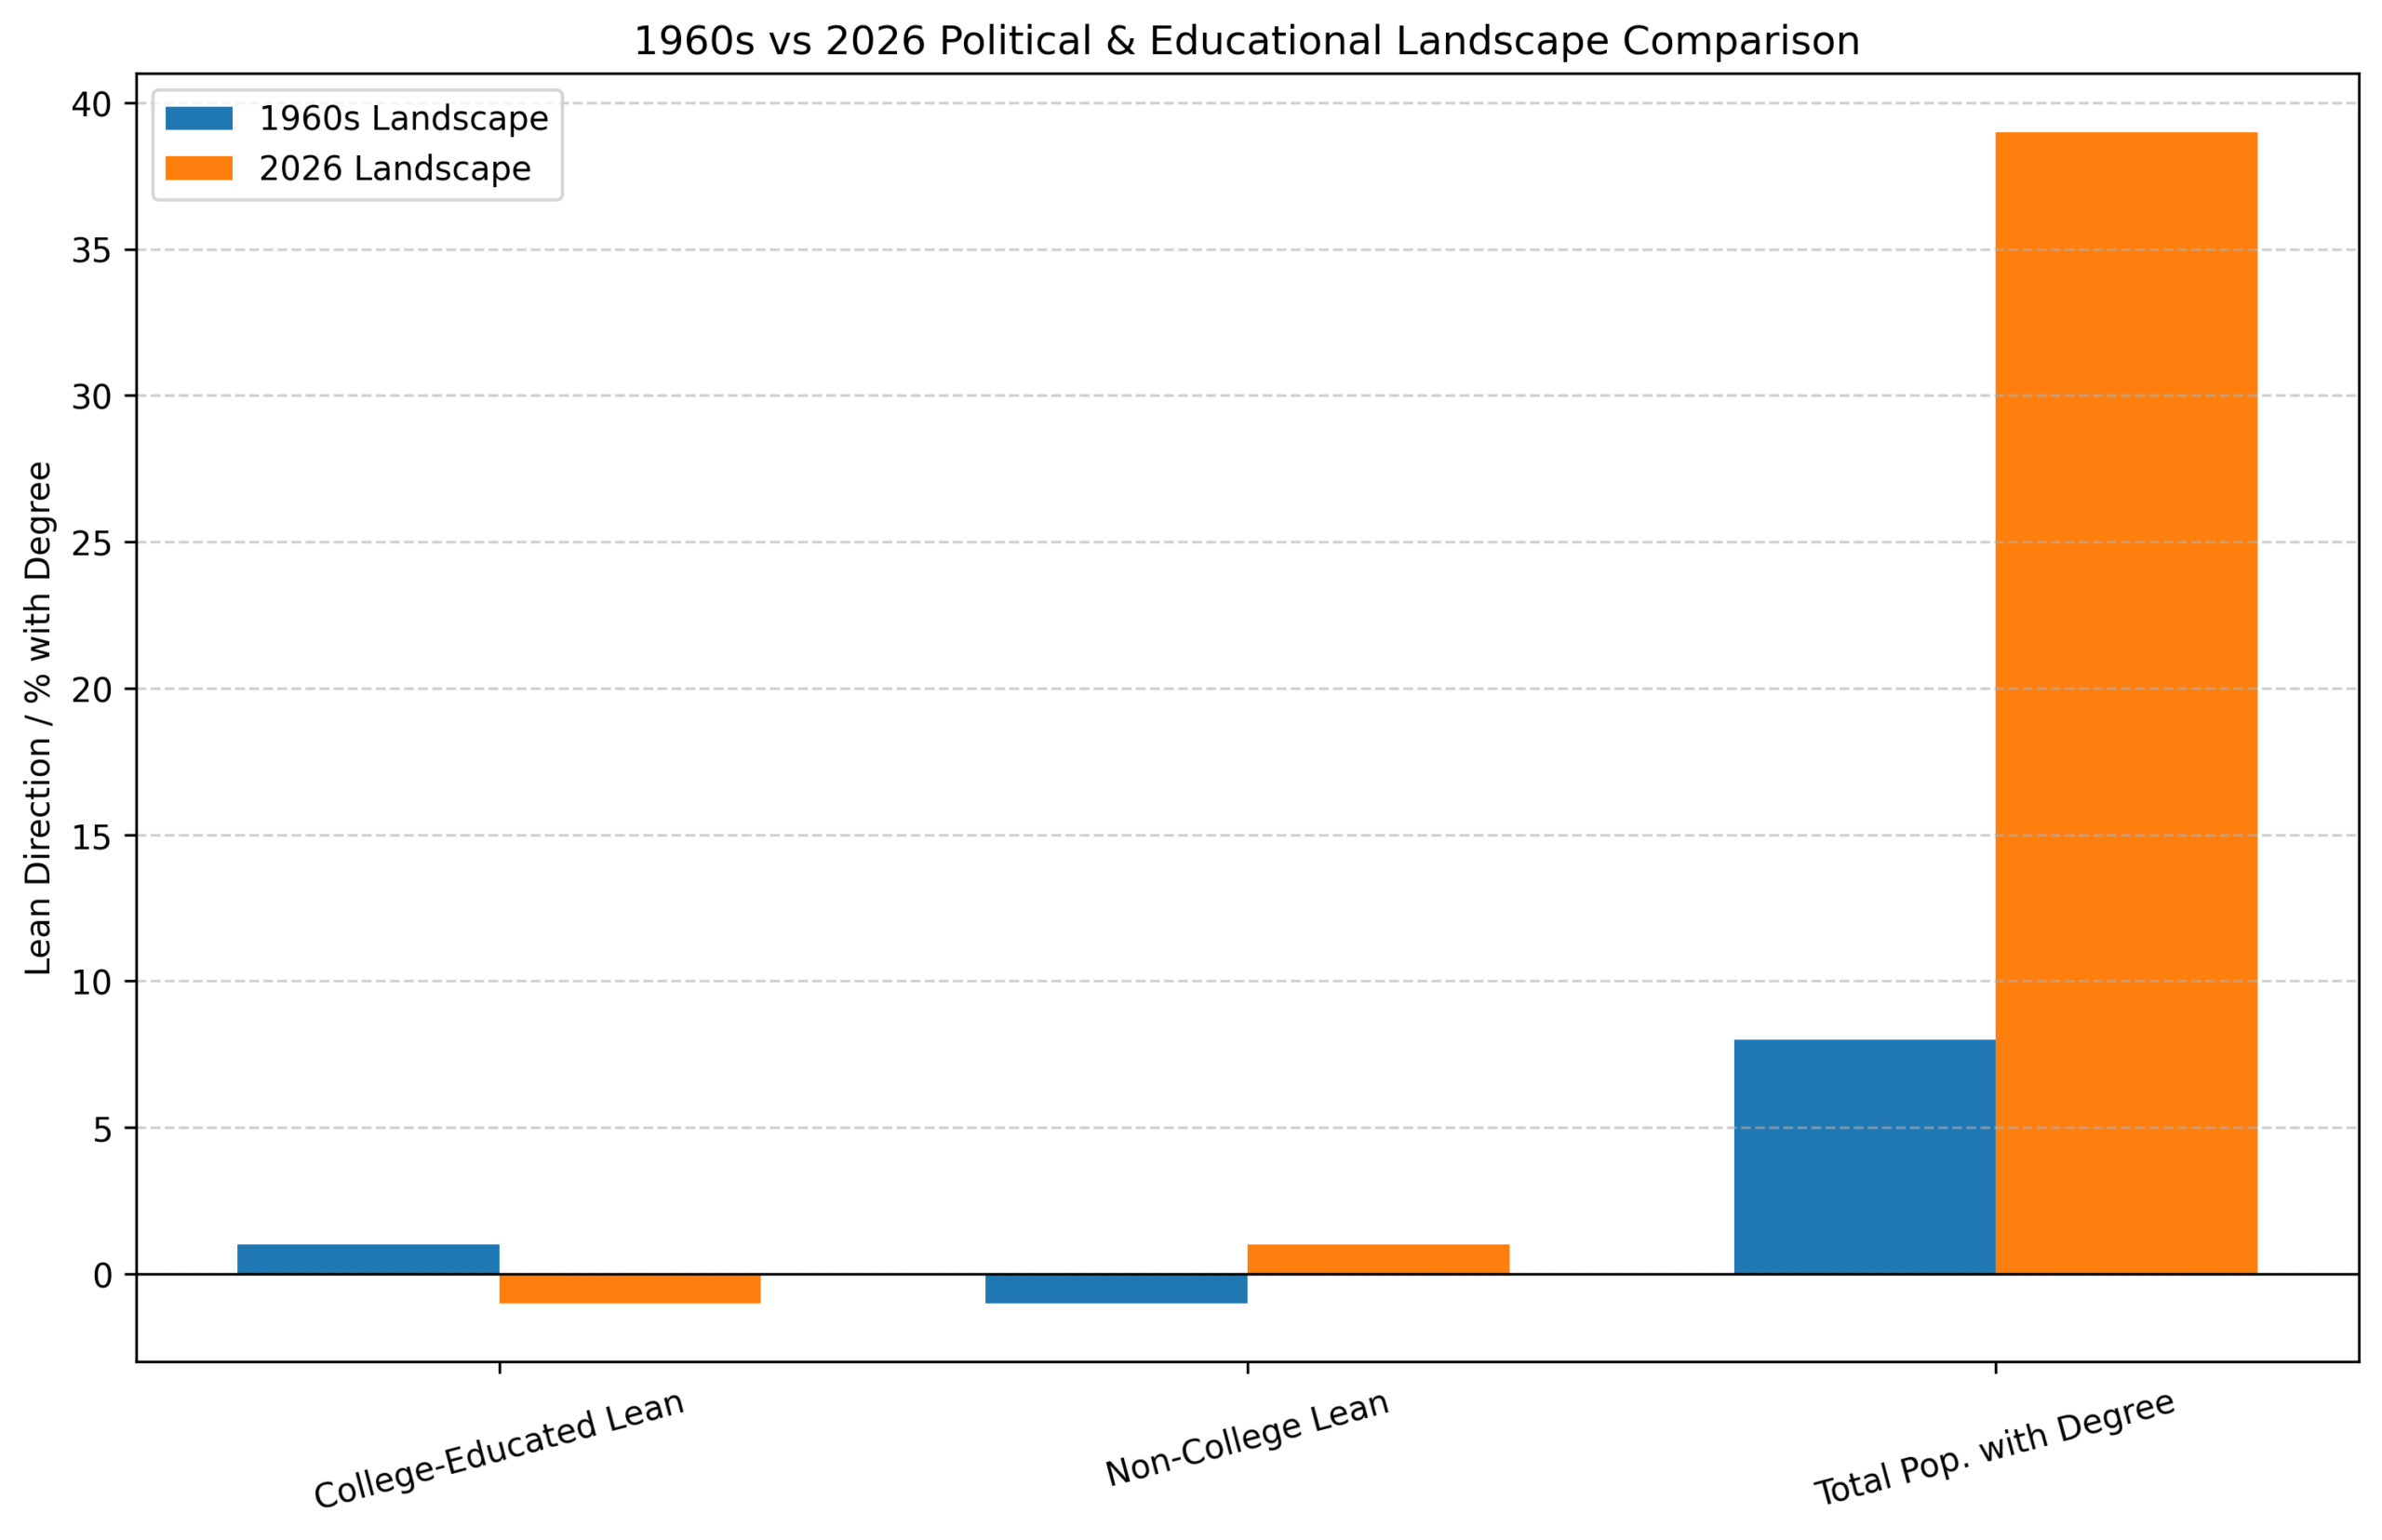
In the 1960s, a college degree was a strong predictor that a voter would be a Republican. Education was closely tied to high income and “big business” interests, which were the hallmarks of the GOP.
| Feature | 1960s Landscape | 2026 Landscape |
| College-Educated Lean | Strongly Republican | Strongly Democratic |
| Non-College Lean | Strongly Democratic | Strongly Republican |
| Total Pop. with Degree | ~8% of adults | ~38-40% of adults |
| Core Identity | Party of the “Common Man” (D) vs. “Business” (R) | Party of “Educated Elites” (D) vs. “Working Class” (R) |
2. The Scale of Education
In 1960, having a college degree was a rare marker of elite status. Only about 7.7% of Americans held a bachelor’s degree.
- 1960s: Because so few people had degrees, education wasn’t a “mass market” political divider. The “Working Class” was the vast majority of both parties.
- 2026: With nearly 40% of the population holding degrees, the “Diploma Divide” has become a mass-scale cultural chasm.
3. The “White Working Class” Shift
The most dramatic change has occurred among white voters.1
- In the 1960s, white voters without degrees (the “working class”) were the backbone of the New Deal Democratic coalition. They voted Democrat for labor protections and social safety nets.
- In 2026, this same demographic is the most reliable Republican voting bloc. This shift was driven by a move away from “economic” voting toward “cultural” voting (issues like immigration, national identity, and traditional values).
4. Why did it flip?
Two major factors caused this 60-year “flip”:
- The Rise of Knowledge Economy: As the U.S. moved from manufacturing to a service and tech-based economy, “education” stopped being just about wealth and started being about worldview. Universities became centers for socially liberal values.
- Party Realignment: Starting with the Civil Rights movement in the 1960s and accelerating through the 1990s, the parties swapped their “cultural” identities. The Democrats became the party of social progressivism (which appeals to the college-educated), while Republicans became the party of traditionalism (which appeals to the non-college-educated).

Comparison of Degree Holders by Party (Estimated)
| Era | % of Democrats with Degrees | % of Republicans with Degrees |
| 1960s | ~5% | ~12% |
| 2026 | ~51% | ~37% |
While comprehensive year-by-year data from 1960 to 2025 is rarely captured in a single dataset, we can use “anchor years” from the American National Election Studies (ANES) and Pew Research to show how the “Diploma Divide” emerged.
In the 1960s, education and party were positively correlated (more education = more Republican). By 2025, they are negatively correlated (more education = more Democratic).
The Inversion: Share of Party Base with a College Degree
Note: These percentages represent the portion of each party’s supporters who hold a 4-year degree.
| Year Range | Era Defining Event | Democrats (BA+) | Republicans (BA+) | The Gap |
| 1960–1968 | Kennedy/LBJ Era | ~5% | ~12% | +7 GOP |
| 1970–1976 | Watergate/Post-60s | ~11% | ~18% | +7 GOP |
| 1980–1988 | Reagan/Bush Era | ~16% | ~24% | +8 GOP |
| 1992–1996 | Clinton “Third Way” | ~22% | ~25% | +3 GOP |
| 2000–2004 | Bush/Gore Polarization | ~26% | ~29% | +3 GOP |
| 2008–2012 | Obama Realignment | ~32% | ~31% | +1 DEM |
| 2016–2020 | Trump Era Surge | ~45% | ~34% | +11 DEM |
| 2024–2025 | Current Landscape | ~51% | ~37% | +14 DEM |

Key Historical “Flipping Points”
- 1960–1980 (The Establishment Era): Education was a sign of economic status. If you had a degree, you likely worked in management or a profession that favored the GOP’s low-tax, pro-business platform. Blue-collar workers were the undisputed heart of the Democratic Party.
- 1992–2004 (The Closing Gap): During the Clinton years, the gap began to narrow. Suburban “moderate” voters with degrees started moving toward Democrats on social issues (like the environment and education), while some white working-class voters began drifting toward the GOP on “cultural” issues.
- 2008 (The Tipping Point): For the first time, the share of college-educated voters in the Democratic Party began to consistently outpace the share in the Republican Party. The 2008 election of Barack Obama accelerated the “brain drain” from the GOP as young, urban professionals flocked to the Democratic brand.
- 2016–2025 (The Great Realignment): This is the most dramatic period of change. Since 2016, the parties have essentially “sorted” themselves by diploma.
- White Democrats saw a massive jump in degree attainment (from 31% in 2008 to over 50% today).1
- Republicans solidified their hold on the “Non-College” vote, which now makes up roughly 63% of their total voting base.2
Summary of the Shift
In 1960, a college graduate was twice as likely to be a Republican.
By 2025, a college graduate is roughly 1.5 times more likely to be a Democrat.